Year 4 Interpret Charts Game 2
Teacher Specific Information
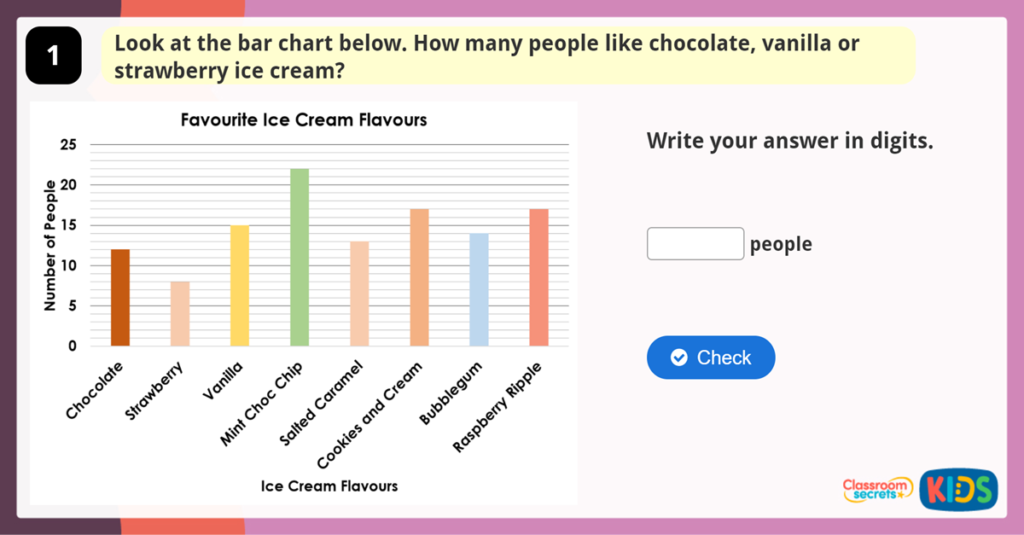
This Year 4 Interpret Charts Game 2 has been designed to check pupils understanding of reading bar charts and pictograms and interpreting the data represented. Pupils will add together numbers represented on a bar chart to determine a total, calculate the difference between values on a bar chart, find 2 values on a bar chart that have a combined total which equals another value and find the dfference and a total on a pictogram where 1 symbol equals 4 units.
If you would like to access additional resources which link to this interactive game, you can purchase a subscription on our sister site, Classroom Secrets.
National Curriculum Objectives
Statistics
(4S1) Interpret and present discrete and continuous data using appropriate graphical methods, including bar charts and time graphs
(4S2) Solve comparison, sum and difference problems using information presented in bar charts, pictograms, tables and other graphs


