Year 3 Solving Problems using Charts Game
Teacher Specific Information
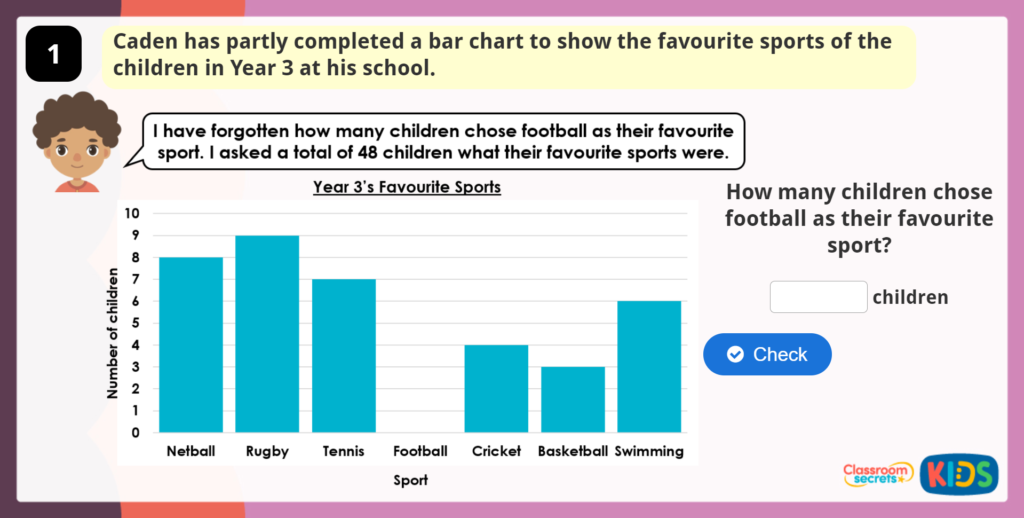
This Year 3 Solving Problems using Charts Game checks pupils’ understanding of solving one and two-step problems using information presented in pictograms, bar charts and tables. Pupils will identify the missing value from a bar chart, identify who has interpreted a pictogram correctly, identify which statements are correct, read a bar chart to solve problems and complete a table using given clues.
If you would like to access additional resources which link to this interactive game, you can purchase a subscription on our sister site, Classroom Secrets.
National Curriculum Objectives
Statistics
Mathematics Year 3: (3S2) Solve one-step and two-step questions [for example, ‘How many more?’ and ‘How many fewer?’] using information presented in scaled bar charts and pictograms and tables


