Year 3 Interpreting Data Maths Challenge
Teacher Specific Information
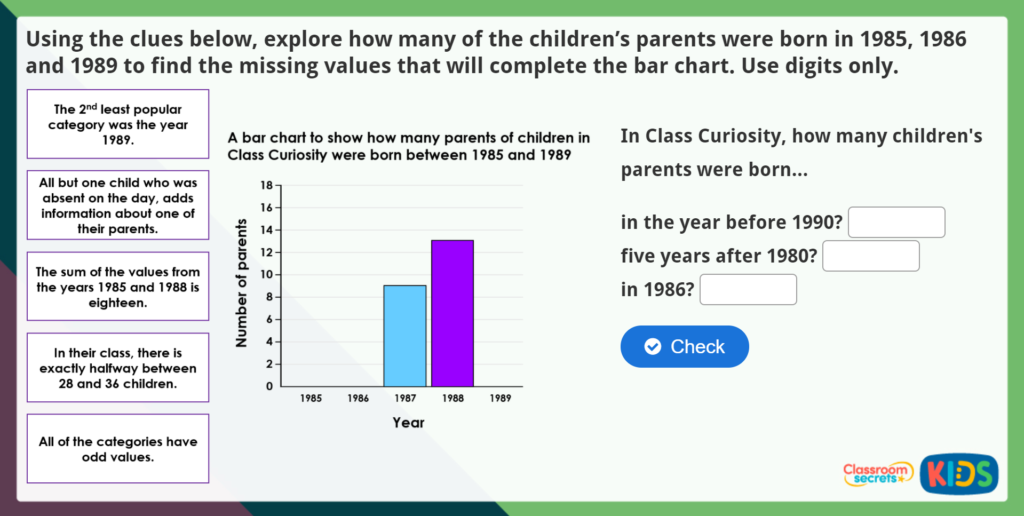
This Year 3 Interpreting Data Maths Challenge has been designed to help develop pupils’ problem-solving skills using their knowledge of interpreting information given on a bar chart. Pupils will need to read the clues in order to calculate the values of the missing bars on the chart.
If you would like to access additional resources which link to this maths challenge, you can purchase a subscription on our sister site, Classroom Secrets.
National Curriculum Objectives
Statistics
Mathematics Year 3: (3S1) Interpret and present data using bar charts, pictograms and tables


