Flashcards
Year 6 The Mean Flash Cards Game
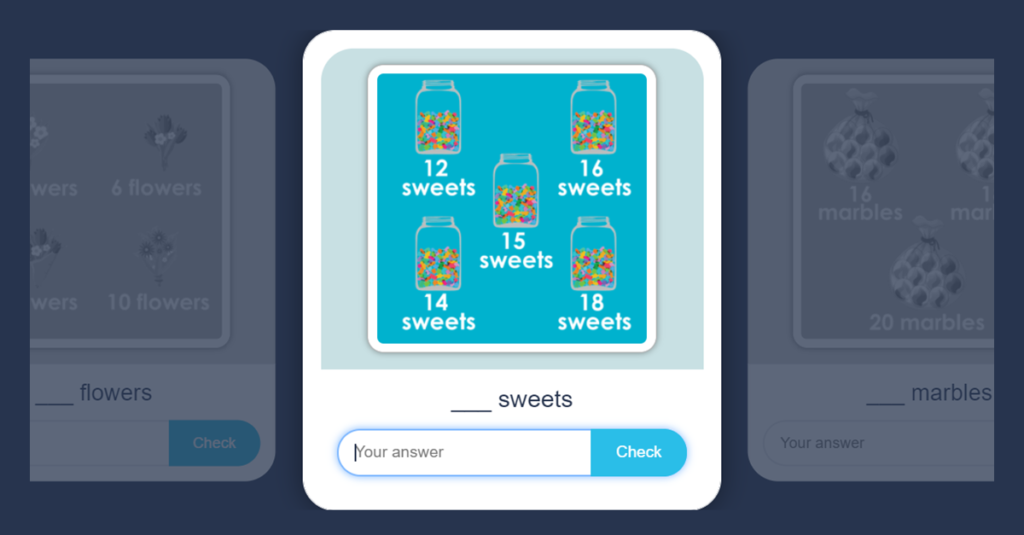
Play this Year 6 The Mean Flash Cards Game and use your knowledge of calculating the mean to answer the eight true or false questions. How many of them will you answer correctly?
Login to playInteractive Games
Year 6 The Mean Game
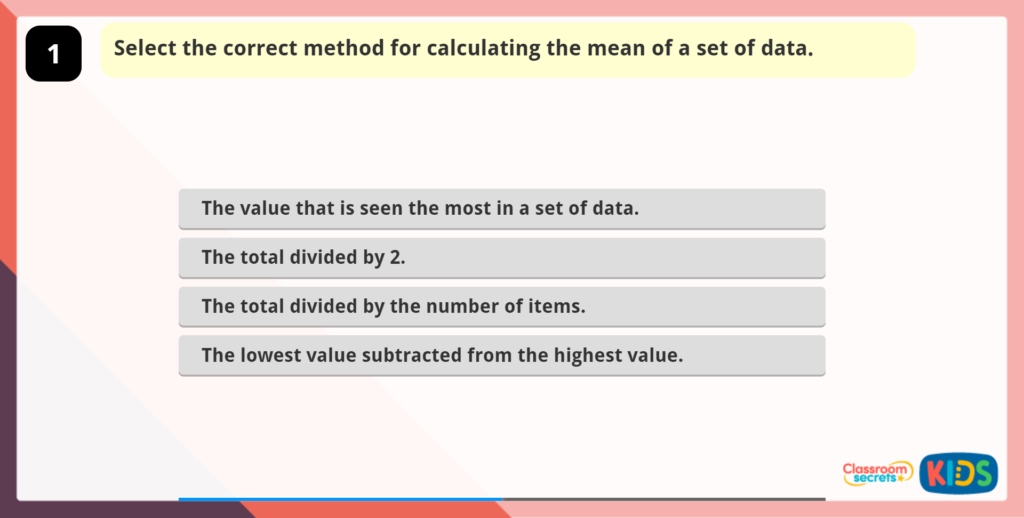
Play this Year 6 The Mean Game and use your understanding of calculating the mean to answer the five questions. How many of them will you answer correctly?
Login to playChallenges
Year 6 Pie Charts Maths Challenge
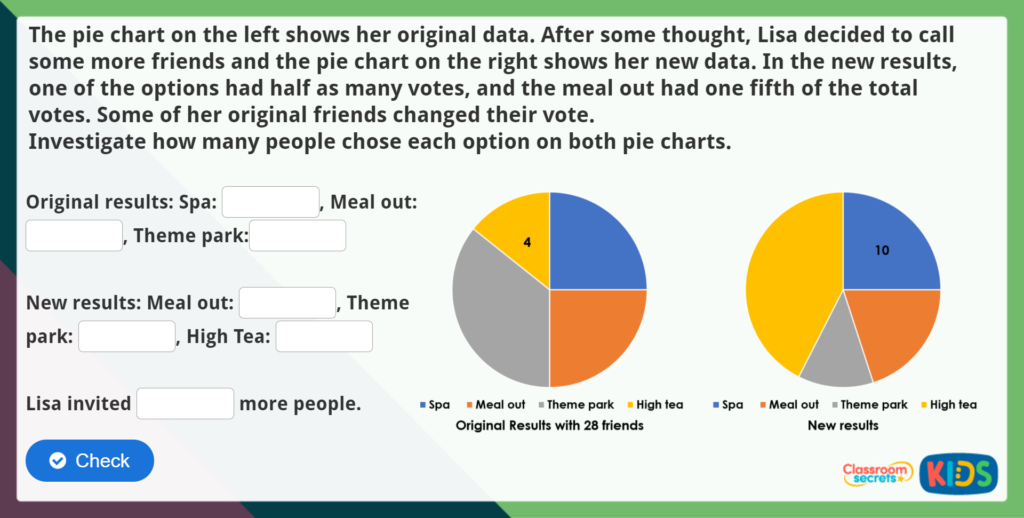
Put your knowledge of pie charts to the ultimate test in this Year 6 Pie Charts Maths Challenge! Use the information provided to work out how many people Lisa invited to her big graduation celebration, and how many of them voted to take part in the different activities!
Login to playInteractive Games
Year 6 Interpret Line Graphs Game
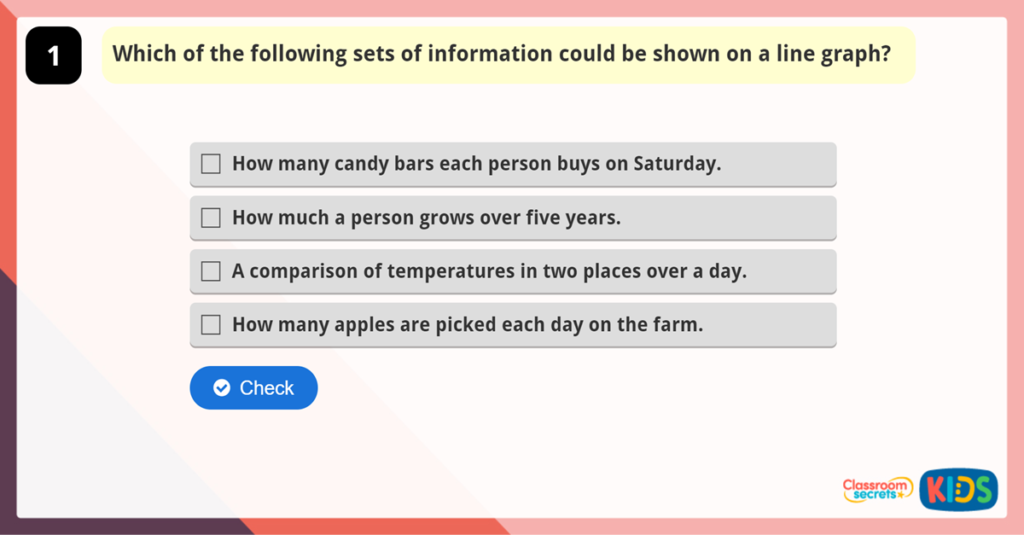
Answer all five questions in this Year 6 Interpret Line Graphs Game to show your understanding of interpreting data on a variety of different line graphs. Can you get them all correct?
Play
Video Tutorials
Pie Charts with Percentages Video Tutorial
Watch Ivan in this Pie Charts with Percentages Video Tutorial to see him demonstrate how to interpret data in a pie chart when it is represented as a percentage. There are questions for you to answer throughout the video. Can you get them all correct?
Play